
Critical updates could provide near-term market insights
Review the latest Weekly Headings by CIO Larry Adam.
- Key consumer and manufacturing data will offer clarity on the economic outlook
- ~44% of S&P 500 market cap will report next week – the busiest week of 1Q26 earnings
- The April FOMC meeting will garner attention as potentially Chair Powell’s last
The past few weeks have delivered a series of milestones for the equity market. The S&P 500 not only posted the fastest recovery to new record highs following a 7%+ drawdown but also crossed above 7,000 for the first time.
What comes next?
The index is on the verge of doubling for the first time in this bull market – currently up ~99% – a move that would take just under 3.5 years, slightly faster than the historical average of 3.9 years. While all sectors are in positive territory over this period, leadership has been narrow with only three – technology, communication services and industrials – posting gains above 100%.
History suggests this bull market still has room to run, as the average cycle lasts 5.6 years and generates gains of roughly 191%. The key question is the near‑term outlook for the economy and markets. We should get important insights next week with critical updates on the conflict in Iran, the economy, earnings and the Federal Reserve (Fed).
Below is what we are watching:
US-Iran conflict uncertainty
The recent ceasefire between the US and Iran – andthe resulting de‑escalation – has been a key catalyst for the rally in risk assets. That said, significant differences remain, including the status of the US blockade, Iran’s future control of the Strait of Hormuz and the duration of curbs on nuclear production, and negotiations have stalled. President Trump extended the ceasefire to allow Iran time to reach an internal consensus, and recent reports suggest the Iranian foreign minister plans to go to Islamabad this weekend. While both sides appear to be searching for an off‑ramp and an end to the conflict, we view the durability of the ceasefire as the most critical factor for markets. Even so, the risk of renewed escalation remains a meaningful tail risk, and the longer the Strait of Hormuz stays closed, the greater the potential for broader economic damage. The coming week will be pivotal for the conflict’s outlook.
Key economic data on tap
Economic fundamentals have remained resilient so far, even in the face of higher energy prices. This week alone, jobless claims held near multi‑decade lows, the retail sales “control group” rose at its fastest pace in seven months and credit card companies – including Synchrony Financial and American Express – highlighted steady spending across both high‑ and low‑income consumers. That said, several real‑time indicators we track are beginning to flash caution. TSA screenings have dipped negative on a year-over-year basis, restaurant bookings are flat and hotel occupancy is running below last year’s levels. The timing of the Easter holiday may be a factor, but these trends warrant close monitoring. Next week should offer greater clarity on the economic outlook. Consumer confidence (April) and PCE (March) will gauge household health and spending, while ISM Manufacturing (April), Durable Goods (March) and regional Fed surveys from Dallas and Richmond will shed light on factory activity. Building permits (March) will also provide an update on housing. While the economy should remain on solid footing, the longer energy prices stay elevated, the greater the risk to underlying fundamentals.
Busiest week of the 1Q26 earnings season
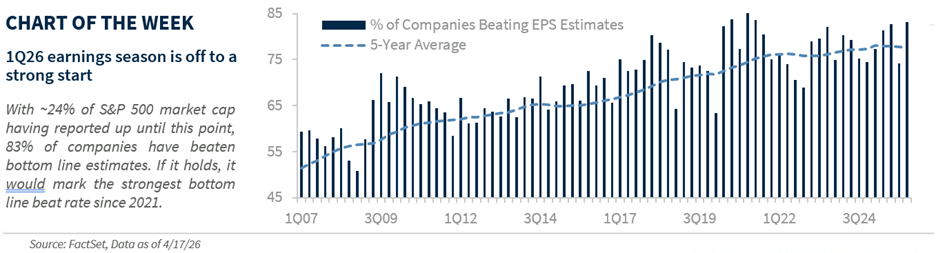
Beyond the de‑escalation in the US-Iran conflict, resilient corporate earnings have been a key catalyst behind the recent advance in equities. With ~24% of S&P 500 market capitalization having reported so far, fundamentals have reinforced investor confidence, as the 1Q26 earnings season has started on a strong note. Despite a higher bar coming into the quarter, ~83% of companies have beaten earnings-per-share (EPS) estimates by an average of 13%, the strongest beat rate and magnitude since 2021. Earnings season is set to accelerate next week, marking the busiest week of the 1Q26 reporting period, with ~44% of S&P 500 market capitalization scheduled to report. Given the recent strength in technology‑related sectors, we expect results from key tech leaders (Apple, Microsoft, Meta and Amazon) to confirm continued momentum in AI demand and investment, supporting our ongoing overweight to the technology sector. Meanwhile, reports from major consumer companies (Visa, Booking Holdings, Hilton and Yum! Brands) and Industrials (Caterpillar and FedEx) should offer valuable insight into the underlying resilience of the economy amid higher energy prices. While we believe corporate fundamentals remain solid, potential downward revisions to elevated forward estimates due to rising input costs could contribute to greater volatility in the weeks ahead.
Powell’s final meeting as Fed chair?
Next week’s April 28-29 Fed meeting is likely to be uneventful from a policy standpoint, with rates widely expected to remain unchanged and no updates to economic projections or the dot plot. The press conference, however, could draw outsized attention. Why? The April meeting is expected to mark Chair Jerome Powell’s final appearance after completing two four‑year terms. Now that the Department of Justice probe of Powell has been dropped, Kevin Warsh’s confirmation may move forward at a faster pace. Powell is still expected to remain chair on a pro tempore basis until his successor is confirmed. Attention will now likely focus on whether he plans to serve through the end of his governor term in early 2028. His remarks may also offer insight into how the Fed is factoring higher energy prices into its evolving inflation outlook. Although futures currently imply only a 31% probability of rate cuts in 2026, we continue to expect a single Fed rate cut this year, most likely in December.
All expressions of opinion reflect the judgment of the author(s) and the Investment Strategy Committee and are subject to change. This information should not be construed as a recommendation. The foregoing content is subject to change at any time without notice. Content provided herein is for informational purposes only. There is no guarantee that these statements, opinions or forecasts provided herein will prove to be correct. Past performance is not a guarantee of future results. Indices and peer groups are not available for direct investment. Any investor who attempts to mimic the performance of an index or peer group would incur fees and expenses that would reduce returns. No investment strategy can guarantee success.
Economic and market conditions are subject to change. Investing involves risks including the possible loss of capital.
The information has been obtained from sources considered to be reliable, but we do not guarantee that the foregoing material is accurate or complete. Diversification and asset allocation do not ensure a profit or protect against a loss.
The S&P 500 Total Return Index: The index is widely regarded as the best single gauge of large-cap U.S. equities. There is over USD 7.8 trillion benchmarked to the index, with index assets comprising approximately USD 2.2 trillion of this total. The index includes 500 leading companies and captures approximately 80% coverage of available market capitalization.
Sector investments are companies focused on a specific economic sector and are presented here for illustrative purposes only. Sectors, including technology, are subject to varying levels of competition, economic sensitivity, and political and regulatory risks. Investing in any individual sector involves limited diversification.
