

Employment shows no signs of letting off
- 04.05.24
- Economy & Policy
- Commentary
Chief Economist Eugenio J. Alemán discusses current economic conditions.
Can Federal Reserve (Fed) officials live with such a strong labor market and still start lowering interest rates in June or July? This question is the reason why we argued, after the latest Fed’s Federal Open Market Committee (FOMC) meeting, that the new ‘dot-plot’ showed that there was no conviction on the short-term path of monetary policy, i.e., on interest rates. That is, we said that the Fed decision was in flux. After that meeting, we have heard several Fed officials arguing for two or even just one downward move during this year.
Let’s recap for a moment. First, inflation continued to slow down, i.e., disinflate, even in the face of a still-strong labor market during the whole of 2023. This means that the strength in the labor market at the start of 2024 should not be an issue. Second, the Fed seems to be sitting pretty, just biding time for interest rates to do their job, remembering that monetary policy acts with “long and variable lags.” In this case, we continue to argue that the lags are even longer today because the post-pandemic cycle was not a monetary cycle but a fiscal cycle. This means that the Fed remains a spectator rather than a player in this game. Third, the U.S. economy continues to grow above potential output, but this has not prevented inflation from coming down, underscoring the continuous improvement in supply chains after the end of the pandemic.
Perhaps the biggest risks Fed officials are watching are related to uncontrollable events, especially issues with geopolitical risks that could threaten inflation as well as inflation expectations. Several of these risks have materialized over the last several months, with oil prices reaching $85 per barrel for the West Texas Intermediate (WTI), the recent news about cocoa prices, and increases in egg prices related to new avian flu affecting the U.S. agricultural sector.
These risks are important but not determinative of Fed policy because as long as core prices—that is, excluding food and energy prices – continue to show downward momentum, it means that the Fed can continue with its plans to start lowering interest rates by mid-year. The biggest question they have to answer is this: in this scenario, are Fed officials willing to start to lower interest rates, i.e., potentially increasing money supply, and continue to feel good about the inflationary path?
The good news is that even in a lower interest rate scenario, the Fed has tools in its tool book, i.e., paying interest on bank reserves, that should limit the potentially expansionary effects over the U.S. economy and thus keep monetary growth contained.
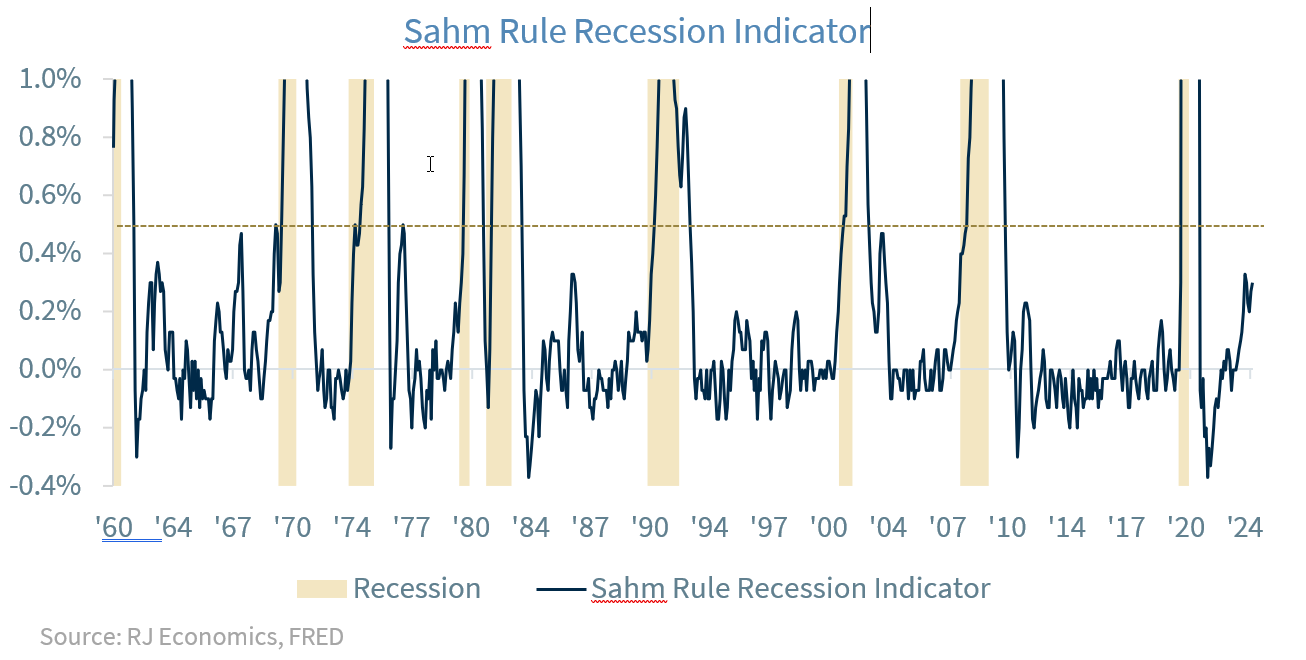
We have also heard all the rumblings around the increase in the Sahm rule, which stood at 0.3% in March and, technically, would indicate a recession if it hits 0.5%, as well as all the recent noise regarding the Sahm rule applied to U.S. states, which is already signaling recession. However, economist Claudia Sahm is arguing to not use states’ Sahm rules to infer recessionary risks.
Furthermore, we would caution about using indicators that have worked in the past to gauge the conditions of the U.S. economy as it is clear that the post-pandemic US economy have made some of these indicators highly unreliable.
The U.S. economy, inflation and the Fed
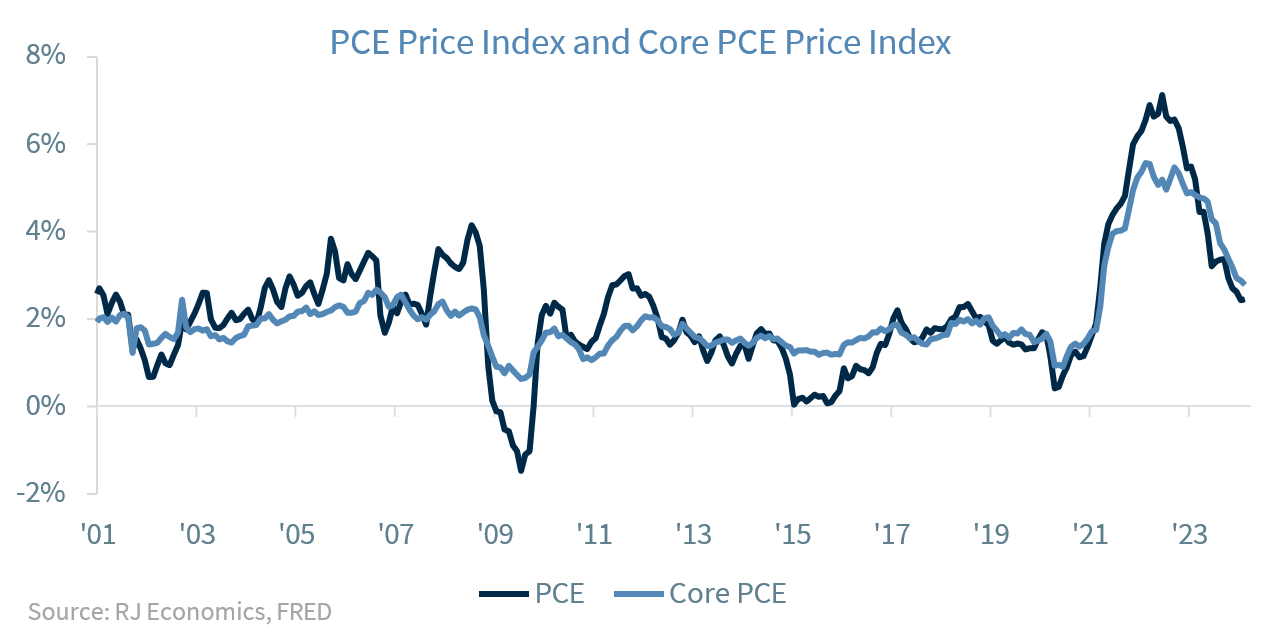
For two years we have been arguing that the Fed needs to see monthly rates of inflation for the Personal Consumption Expenditures price index of, at most, 0.15% per month on average, for a full year, in order to achieve their target inflation rate of 2%. However, markets remained oblivious to how difficult it was going to be for the Fed to achieve the target and how long, and tough, the road forward was going to be.
On the other hand, many analysts continued to contend that markets should expect higher inflation than 2% in the future and that the Fed will not be able to achieve its 2% target, with the implied argument that the Fed will have to change its inflation target to a higher rate of inflation. Many times, we have argued that this argument makes no sense because the Fed “targets” a specific inflation rate and that is their target.
Let’s bring this argument down to our own working life. Let’s say that your boss meets with you and says that this year’s target is X and that your performance bonus and next year’s raise will be contingent on achieving the target, X. That’s it, you start your year with your target in mind and do everything in line with trying to achieve your target. If, at the end of the year, you don’t meet your target, then you failed.
For the Fed, this is what they have to do. They have to put in place a monetary policy scheme that will enable them to hit their 2% target. If today’s interest rates are not enough for them to hit the inflation target, then they will need to adjust their policy to achieve their target. For them, the target is 2% over a period of time, which means that they can be patient on the road to achieving their target.
The Fed is estimating they will be achieving their target by 2026 and they continue to look for more signs and assurances that current monetary policy will enable them to achieve the target. Once they are convinced that inflation is heading that way, they will be ready to start cutting interest rates.
Economic and market conditions are subject to change.
Opinions are those of Investment Strategy and not necessarily those of Raymond James and are subject to change without notice. The information has been obtained from sources considered to be reliable, but we do not guarantee that the foregoing material is accurate or complete. There is no assurance any of the trends mentioned will continue or forecasts will occur. Last performance may not be indicative of future results.
Consumer Price Index is a measure of inflation compiled by the US Bureau of Labor Statistics. Currencies investing is generally considered speculative because of the significant potential for investment loss. Their markets are likely to be volatile and there may be sharp price fluctuations even during periods when prices overall are rising.
Consumer Sentiment is a consumer confidence index published monthly by the University of Michigan. The index is normalized to have a value of 100 in the first quarter of 1966. Each month at least 500 telephone interviews are conducted of a contiguous United States sample.
Personal Consumption Expenditures Price Index (PCE): The PCE is a measure of the prices that people living in the United States, or those buying on their behalf, pay for goods and services. The change in the PCE price index is known for capturing inflation (or deflation) across a wide range of consumer expenses and reflecting changes in consumer behavior.
The Consumer Confidence Index (CCI) is a survey, administered by The Conference Board, that measures how optimistic or pessimistic consumers are regarding their expected financial situation. A value above 100 signals a boost in the consumers’ confidence towards the future economic situation, as a consequence of which they are less prone to save, and more inclined to consume. The opposite applies to values under 100.
Certified Financial Planner Board of Standards Inc. owns the certification marks CFP®, CERTIFIED FINANCIAL PLANNER™, CFP® (with plaque design) and CFP® (with flame design) in the U.S., which it awards to individuals who successfully complete CFP Board's initial and ongoing certification requirements.
Links are being provided for information purposes only. Raymond James is not affiliated with and does not endorse, authorize or sponsor any of the listed websites or their respective sponsors. Raymond James is not responsible for the content of any website or the collection or use of information regarding any website's users and/or members.
GDP Price Index: A measure of inflation in the prices of goods and services produced in the United States. The gross domestic product price index includes the prices of U.S. goods and services exported to other countries. The prices that Americans pay for imports aren't part of this index.
The Conference Board Leading Economic Index: Intended to forecast future economic activity, it is calculated from the values of ten key variables.
The Conference Board Coincident Economic Index: An index published by the Conference Board that provides a broad-based measurement of current economic conditions.
The Conference Board lagging Economic Index: an index published monthly by the Conference Board, used to confirm and assess the direction of the economy's movements over recent months.
The U.S. Dollar Index is an index of the value of the United States dollar relative to a basket of foreign currencies, often referred to as a basket of U.S. trade partners' currencies. The Index goes up when the U.S. dollar gains "strength" when compared to other currencies.
The FHFA House Price Index (FHFA HPI®) is a comprehensive collection of public, freely available house price indexes that measure changes in single-family home values based on data from all 50 states and over 400 American cities that extend back to the mid-1970s.
Import Price Index: The import price index measure price changes in goods or services purchased from abroad by U.S. residents (imports) and sold to foreign buyers (exports). The indexes are updated once a month by the Bureau of Labor Statistics (BLS) International Price Program (IPP).
ISM New Orders Index: ISM New Order Index shows the number of new orders from customers of manufacturing firms reported by survey respondents compared to the previous month. ISM Employment Index: The ISM Manufacturing Employment Index is a component of the Manufacturing Purchasing Managers Index and reflects employment changes from industrial companies.
ISM Inventories Index: The ISM manufacturing index is a composite index that gives equal weighting to new orders, production, employment, supplier deliveries, and inventories.
ISM Production Index: The ISM manufacturing index or PMI measures the change in production levels across the U.S. economy from month to month.
ISM Services PMI Index: The Institute of Supply Management (ISM) Non-Manufacturing Purchasing Managers' Index (PMI) (also known as the ISM Services PMI) report on Business, a composite index is calculated as an indicator of the overall economic condition for the non-manufacturing sector.
Consumer Price Index (CPI) A consumer price index is a price index, the price of a weighted average market basket of consumer goods and services purchased by households. Changes in measured CPI track changes in prices over time.
Producer Price Index: A producer price index (PPI) is a price index that measures the average changes in prices received by domestic producers for their output.
Industrial production: Industrial production is a measure of output of the industrial sector of the economy. The industrial sector includes manufacturing, mining, and utilities. Although these sectors contribute only a small portion of gross domestic product, they are highly sensitive to interest rates and consumer demand.
The NAHB/Wells Fargo Housing Opportunity Index (HOI) for a given area is defined as the share of homes sold in that area that would have been affordable to a family earning the local median income, based on standard mortgage underwriting criteria.
The S&P CoreLogic Case-Shiller U.S. National Home Price NSA Index measures the change in the value of the U.S. residential housing market by tracking the purchase prices of single-family homes.
The S&P CoreLogic Case-Shiller 20-City Composite Home Price NSA Index seeks to measures the value of residential real estate in 20 major U.S. metropolitan.
Source: FactSet, data as of 7/7/2023
