
Weakness in housing ups the ante
Chief Economist Eugenio J. Alemán discusses current economic conditions.
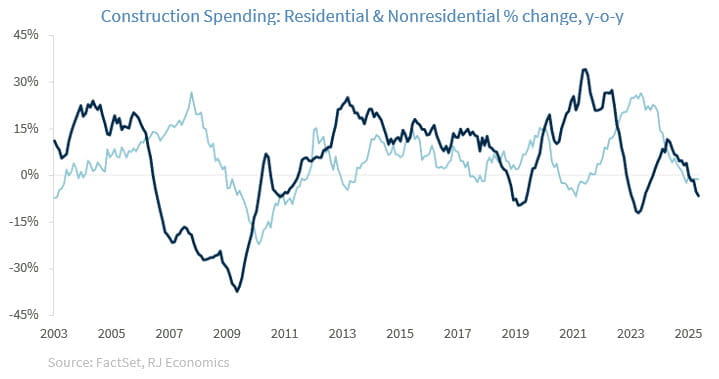
The ability of the US economy to avoid a recession in 2022-2023, as the Federal Reserve (Fed) increased interest rates, rested, in part, on the resilience of non-residential investment, which was propped up by a strong private investment push from companies taking advantage of provisions in both the CHIPS Act as well as the IRA. But the effects from those two acts are starting to fade, which means that the non-residential investment buffer will not be there if the decline in residential investment is large.1
As the graph below shows, today, both residential and nonresidential construction spending are declining. This means that the risks of recession are still high today because the buffer that existed back in 2022-2023 is no longer there.
Recent data on builder sentiment, housing starts, and home sales, but especially on new home sales, all point to a housing market that is weakening again. This is likely the reason the Trump administration is putting so much pressure on the Fed to lower interest rates. However, as we have seen since the Fed started lowering interest rates last year, its effects on mortgage rates have been relatively muted, as the yield on the 10-year Treasury has remained almost unchanged as markets continue to expect higher inflation in the future. Thus, even if the Fed lowered interest rates, there are no guarantees that the yield on the 10-year Treasury and, thus, mortgage rates, will come down any time soon.
Furthermore, a critical factor in today’s housing market is the so-called ‘lock-in effect.’ As of Q12025, 81% of outstanding mortgage debt is locked in below 6%, with over 53% of homeowners holding mortgages below 4%. Only 18.8% of borrowers have rates above 6%. Furthermore, the average mortgage interest rate is 4.3%.2
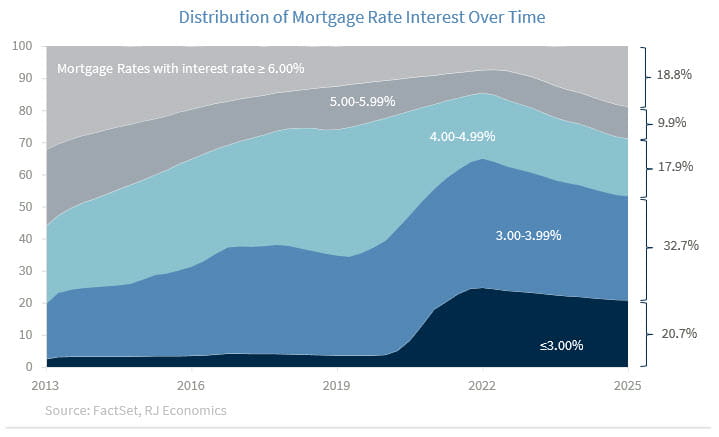
This creates a powerful disincentive for households to relocate and be willing to sell their homes. For most homeowners, trading a 3% mortgage for a 6.5% one simply doesn’t make financial sense. Even if mortgage rates fall modestly, it may not be enough to unlock a larger inventory of homes. Given the current outstanding mortgage debt environment, rates will likely need to fall below 5%, and possibly closer to 4.5%, before a meaningful number of homeowners will consider selling.
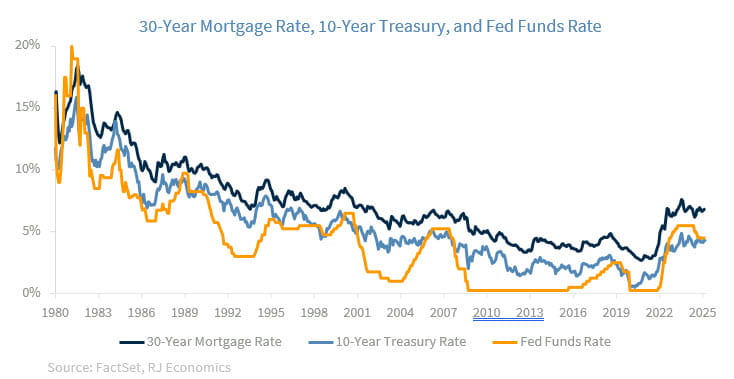
The Fed began cutting rates in late 2024, and we expect further easing in the second half of 2025. But as we argued above (see graph), history shows that mortgage rates don’t increase or fall in lockstep with the Fed funds rate. In the 2001 and 2019 cutting cycles, mortgage rates declined gradually and modestly. During the 2007–2008 crisis, rates didn’t fall significantly until the Fed began buying mortgage-backed securities, as it implemented what was called Quantitative Easing.
Mortgage rates are more closely tied to the 10-year Treasury yield, and the spread between Treasuries and mortgage rates has widened due to market volatility and risk aversion. Even if the Fed cuts rates by 100 basis points over the next 12 months, mortgage rates may only decline incrementally.
The housing market is waiting for a catalyst, and that catalyst is lower mortgage rates. But the path to lower rates is highly uncertain and likely to be slow, unless the US economy goes into a recession. Until then, the market will remain constrained by tight inventory, high prices, and cautious builders.
If the Fed continues easing into 2026 and inflation remains under control, we could see mortgage rates fall below 5%. However, today, the Fed, as well as markets, are focused on the inflationary effects of tariffs, which is going to delay any meaningful reduction in mortgage rates. If mortgage rates fall below 5%, that is when we expect the lock-in effect to begin to ease. At that time, the inventory of homes could rise considerably, home prices would start to fall, and affordability would probably improve. Until then, the housing market will remain a drag on economic growth, one that could push the US economy closer to a recession.
1: We thank Tavis McCourt for pointing out that “non-residential construction put in place,” which skyrocketed in 2022, has started to weaken.
2: National Mortgage Database
Economic and market conditions are subject to change.
Opinions are those of Investment Strategy and not necessarily those of Raymond James and are subject to change without notice. The information has been obtained from sources considered to be reliable, but we do not guarantee that the foregoing material is accurate or complete. There is no assurance any of the trends mentioned will continue or forecasts will occur. Past performance may not be indicative of future results.
Consumer Price Index is a measure of inflation compiled by the US Bureau of Labor Statistics. Currencies investing is generally considered speculative because of the significant potential for investment loss. Their markets are likely to be volatile and there may be sharp price fluctuations even during periods when prices overall are rising.
Consumer Sentiment is a consumer confidence index published monthly by the University of Michigan. The index is normalized to have a value of 100 in the first quarter of 1966. Each month at least 500 telephone interviews are conducted of a contiguous United States sample.
Personal Consumption Expenditures Price Index (PCE): The PCE is a measure of the prices that people living in the United States, or those buying on their behalf, pay for goods and services. The change in the PCE price index is known for capturing inflation (or deflation) across a wide range of consumer expenses and reflecting changes in consumer behavior.
The Consumer Confidence Index (CCI) is a survey, administered by The Conference Board, that measures how optimistic or pessimistic consumers are regarding their expected financial situation. A value above 100 signals a boost in the consumers’ confidence towards the future economic situation, as a consequence of which they are less prone to save, and more inclined to consume. The opposite applies to values under 100.
Certified Financial Planner Board of Standards Center for Financial Planning, Inc. owns and licenses the certification marks CFP®, CERTIFIED FINANCIAL PLANNER®, and CFP® (with plaque design) in the United States to Certified Financial Planner Board of Standards, Inc., which authorizes individuals who successfully complete the organization’s initial and ongoing certification requirements to use the certification marks.
Links are being provided for information purposes only. Raymond James is not affiliated with and does not endorse, authorize or sponsor any of the listed websites or their respective sponsors. Raymond James is not responsible for the content of any website or the collection or use of information regarding any website's users and/or members.
GDP Price Index: A measure of inflation in the prices of goods and services produced in the United States. The gross domestic product price index includes the prices of U.S. goods and services exported to other countries. The prices that Americans pay for imports aren't part of this index.
Employment cost Index: The Employment Cost Index (ECI) measures the change in the hourly labor cost to employers over time. The ECI uses a fixed “basket” of labor to produce a pure cost change, free from the effects of workers moving between occupations and industries and includes both the cost of wages and salaries and the cost of benefits.
US Dollar Index: The US Dollar Index is an index of the value of the United States dollar relative to a basket of foreign currencies, often referred to as a basket of U.S. trade partners' currencies. The Index goes up when the
U.S. dollar gains "strength" when compared to other currencies.
Import Price Index: The import price index measure price changes in goods or services purchased from abroad by U.S. residents (imports) and sold to foreign buyers (exports). The indexes are updated once a month by the Bureau of Labor Statistics (BLS) International Price Program (IPP).
ISM Services PMI Index: The Institute of Supply Management (ISM) Non-Manufacturing Purchasing Managers' Index (PMI) (also known as the ISM Services PMI) report on Business, a composite index is calculated as an indicator of the overall economic condition for the non-manufacturing sector.
Consumer Price Index (CPI) A consumer price index is a price index, the price of a weighted average market basket of consumer goods and services purchased by households.
Producer Price Index: A producer price index(PPI) is a price index that measures the average changes in prices received by domestic producers for their output.
Industrial production: Industrial production is a measure of output of the industrial sector of the economy. The industrial sector includes manufacturing, mining, and utilities. Although these sectors contribute only a small portion of gross domestic product, they are highly sensitive to interest rates and consumer demand.
The NAHB/Wells Fargo Housing Opportunity Index (HOI) for a given area is defined as the share of homes sold in that area that would have been affordable to a family earning the local median income, based on standard mortgage underwriting criteria.
Conference Board Coincident Economic Index: The Composite Index of Coincident Indicators is an index published by the Conference Board that provides a broad-based measurement of current economic conditions, helping economists, investors, and public policymakers to determine which phase of the business cycle the economy is currently experiencing.
Conference Board Lagging Economic Index: The Composite Index of Lagging Indicators is an index published monthly by the Conference Board, used to confirm and assess the direction of the economy's movements over recent months.
New Export Index: The PMI New export orders index allows us to track international demand for a country's goods and services on a timely, monthly, basis.
Gold is subject to the special risks associated with investing in precious metals, including but not limited to: price may be subject to wide fluctuation; the market is relatively limited; the sources are concentrated in countries that have the potential for instability; and the market is unregulated.
The Conference Board Leading Economic Index: Intended to forecast future economic activity, it is calculated from the values of ten key variables.
Source: FactSet, data as of 12/6/2024