
Five takeaways from first quarter earnings season
Key takeaways:
Review the latest Weekly Headings by CIO Larry Adam.
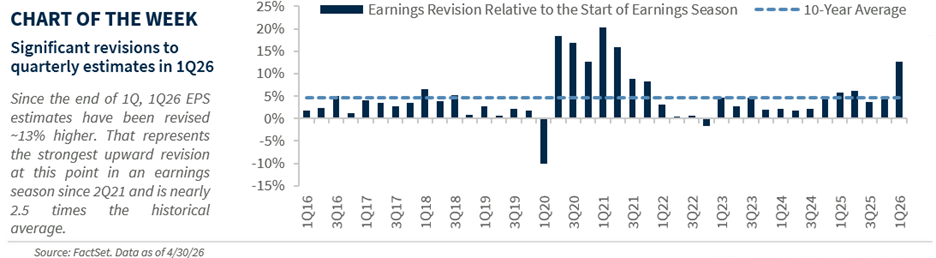
- S&P 500 earnings have seen the strongest upward revision to EPS in four years
- Mega-cap tech has been the standout through 1Q earnings
- Despite headwinds from rising energy costs, margins hit a record in 1Q
With 82% of market cap having reported, the S&P 500 is on track for 27% year-over-year earnings per share (EPS) growth, the strongest since 4Q21. More than 84% have beaten earnings estimates − the most since 1Q21 − while earnings revisions are up 12%, the fastest pace in four years. That said, here are five other takeaways from 1Q26 earnings season so far:
Consumer remains on solid footing
While rising gas prices have weighed on consumer sentiment − the University of Michigan Sentiment Survey fell to a record low in April − real‑time indicators suggest consumer spending remains healthy. This view was echoed by management commentary during 1Q26 earnings calls. Banks pointed to continued consumer resilience with limited deterioration in credit quality, while credit card companies reported solid spending growth across all income cohorts, with some noting recent acceleration. At the industry level, airlines are seeing strong forward booking demand and select restaurants this week highlighted healthy overall spending. While elevated gas prices remain a near‑term headwind, solid consumer demand should continue to support growth.
Mega-cap a standout
Against a backdrop of strong earnings growth, mega‑cap tech once again stood out. MAGMAN* is on track to deliver 59% year-over-year EPS growth, versus just 12% for the rest of the index, marking a 13th straight quarter of earnings outperformance. Mega‑cap tech exceeded estimates by ~35% on average − the strongest beat since 1Q21 − while margins expanded to a record 34%, more than three times the broader index. While one‑time income tied to private‑investment revaluations (e.g., Anthropic) lifted results, underlying profitability remains strong. Excluding these items, EPS growth still would have been a healthy 18%. With investment demand continuing to outpace supply, 2026 hyperscaler capex remains robust − revised 12% higher in Q1 to ~$720 billion − while valuations remain below their five‑year average. These fundamentals support our overweight to mega‑cap tech, reinforcing that recent outperformance is justified.
Capital expenditure is booming
We have consistently highlighted the positive impact of the One Big Beautiful Bill on consumers through higher tax refunds. On the business side, the R&D expensing provision, which allows immediate expensing of capital investments, has driven a notable surge in corporate capital expenditures. S&P 500 capex is on pace to rise 32% year over year, the fastest growth since 2007. While hyperscaler-led AI investment remains the primary driver, capital spending across the rest of the index is also gaining momentum, with ex-hyperscaler capex projected to increase a healthy 16% year over year. Notably, seven out of 11 sectors are expected to deliver more than 10% year-over-year capex growth in 2026. With nonresidential investment contributing more to 1Q GDP growth than consumer spending, the current capex boom should provide a meaningful tailwind to both GDP and earnings growth moving forward.
Margins hit a record high
The resilience of US corporate profitability has been striking. Despite tariff pressures and higher energy and input costs, S&P 500 margins rose for a fifth consecutive quarter, reaching a record high of 16%. To put that in perspective, margins have increased by three percentage points over the past two years, an outcome that is historically unprecedented outside of recessionary recovery periods. That said, early signs of pressure are beginning to emerge. While the Iran conflict affected only one month of 1Q results, roughly 30% of S&P 500 companies cited rising input costs − the highest share since 2022 − and eight of 11 sectors are expected to see declines in margins in 2Q. Although strong technology‑sector margins should keep overall profitability elevated relative to history, persistently high energy prices would raise downside risk going forward.
International earnings are mixed but still rising
While 1Q26 US earnings have been notably strong, international results have been a more mixed picture. Emerging markets earnings posted robust growth, rising 32% year over year in Q1, while Europe continued to lag with more modest growth of just 2% year over year.Heightened vulnerability and disruptions tied to the Middle East conflict have affected international markets unevenly. The MSCI Emerging Markets Index reached its 20th all-time high this week and is up 24% year to date, supported by tech-led earnings growth, particularly in Korea and Taiwan. In contrast, European earnings growth has been largely confined to the energy sector, which has benefited from upward revisions since the onset of the conflict. Case in point: Excluding energy, the Stoxx Europe 600’s earnings actually declined 1% in Q1, reflecting weakness across consumer-exposed areas such as travel and leisure, autos and luxury goods.
*MAGMAN represents a composite of Microsoft, Apple, Google, Meta, Amazon, Nvidia. The foregoing is not a recommendation to buy or sell MAGMAN stocks.
All expressions of opinion reflect the judgment of the author(s) and the Investment Strategy Committee and are subject to change. This information should not be construed as a recommendation. The foregoing content is subject to change at any time without notice. Content provided herein is for informational purposes only. There is no guarantee that these statements, opinions or forecasts provided herein will prove to be correct. Past performance is not a guarantee of future results. Indices and peer groups are not available for direct investment. Any investor who attempts to mimic the performance of an index or peer group would incur fees and expenses that would reduce returns. No investment strategy can guarantee success.
Economic and market conditions are subject to change. Investing involves risks including the possible loss of capital.
The information has been obtained from sources considered to be reliable, but we do not guarantee that the foregoing material is accurate or complete. Diversification and asset allocation do not ensure a profit or protect against a loss.
The S&P 500 Total Return Index: The index is widely regarded as the best single gauge of large-cap U.S. equities. There is over USD 7.8 trillion benchmarked to the index, with index assets comprising approximately USD 2.2 trillion of this total. The index includes 500 leading companies and captures approximately 80% coverage of available market capitalization.
Sector investments are companies focused on a specific economic sector and are presented here for illustrative purposes only. Sectors, including technology, are subject to varying levels of competition, economic sensitivity, and political and regulatory risks. Investing in any individual sector involves limited diversification.