

Expansionary & recessionary periods
Doug Drabik discusses fixed income market conditions and offers insight for bond investors.
An economic expansion is defined as a period during which the economy is growing, characterized by increased activity and robust employment. The Gross Domestic Product (GDP) is rising. Conversely, a recessionary period occurs when there is a decrease in aggregate demand, resulting in an economic decline. GDP and employment are often falling.
The last 13 recessionary and expansionary periods are detailed in the chart. The average length of a recessionary period during these 80 years was 0.9 years, with the longest one, the Great Recession, spanning from December 2007 to June 2009 (1.6 years). Expansionary periods have lasted longer, averaging 5.3 years over the same time.
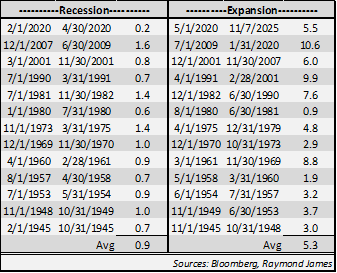
Recent history paints a different story. The last four recessions averaged 0.9 years, identical to the 80-year average. However, the last four expansionary periods average 8.5 years, extending more than twice as long as the average of the previous nine expansionary periods. Several questions come to light. Has the government and the Fed figured out how to suppress recessions? Soft landings, as they are referred to, occur when the Central Bank (the Fed) prevents the economy from overheating while avoiding both uncontrolled inflation and a recession. If so, is this constructive, or does it amplify any adverse consequences of the next recession as economic cycles eventually move full circle?
There appears to be some cracks in employment strength. Nonfarm Payrolls, which measure the number of jobs added or lost in the economy, have shown diminishing strength, falling well below averages in each of the last four monthly reports. Still, the overall unemployment rate stands at 4.3%, well inside what is often referred to as full employment or the level of jobs expected in a healthy economy. The net level of employment remains favorable, yet the negative directional trend gives the Fed and investors pause for concern. Further hesitation might be inferred from the recent inflation statistics, as measured by the Consumer Price Index (CPI). Although the data release was below expectations, it was the highest print this year and the fourth increase in the last five months, indicating that inflation is far from quelled.
It seems that 2025 is not the down year many anticipated. The expansionary phase continues with the third consecutive year of substantial stock market gains and the third year of elevated interest rates. The economy continues to expand although slowed in pace and biased in specific sectors and for selective investors.
The shaded areas of the graph highlight the most recent recessionary periods, while the unshaded regions mark the expansionary periods. The line of the graph is the 10-year Treasury rate minus the 3-month Treasury Bill. When the 3-month Bill yield is greater than the 10-year Treasury yield, the line dips below 0,
the red horizontal line. This reflects an inverted yield curve. It is also noteworthy to show that recessions follow shortly after an inverted yield curve becomes upward sloping, or what is considered a “normal” yield curve shape. For the last 200+ days, the yield curve has flirted with remaining inverted versus turning upward sloping, all the while keeping the economy in its expansionary state. The uncertainty remains unresolved as inflation persists and the job market becomes tentative.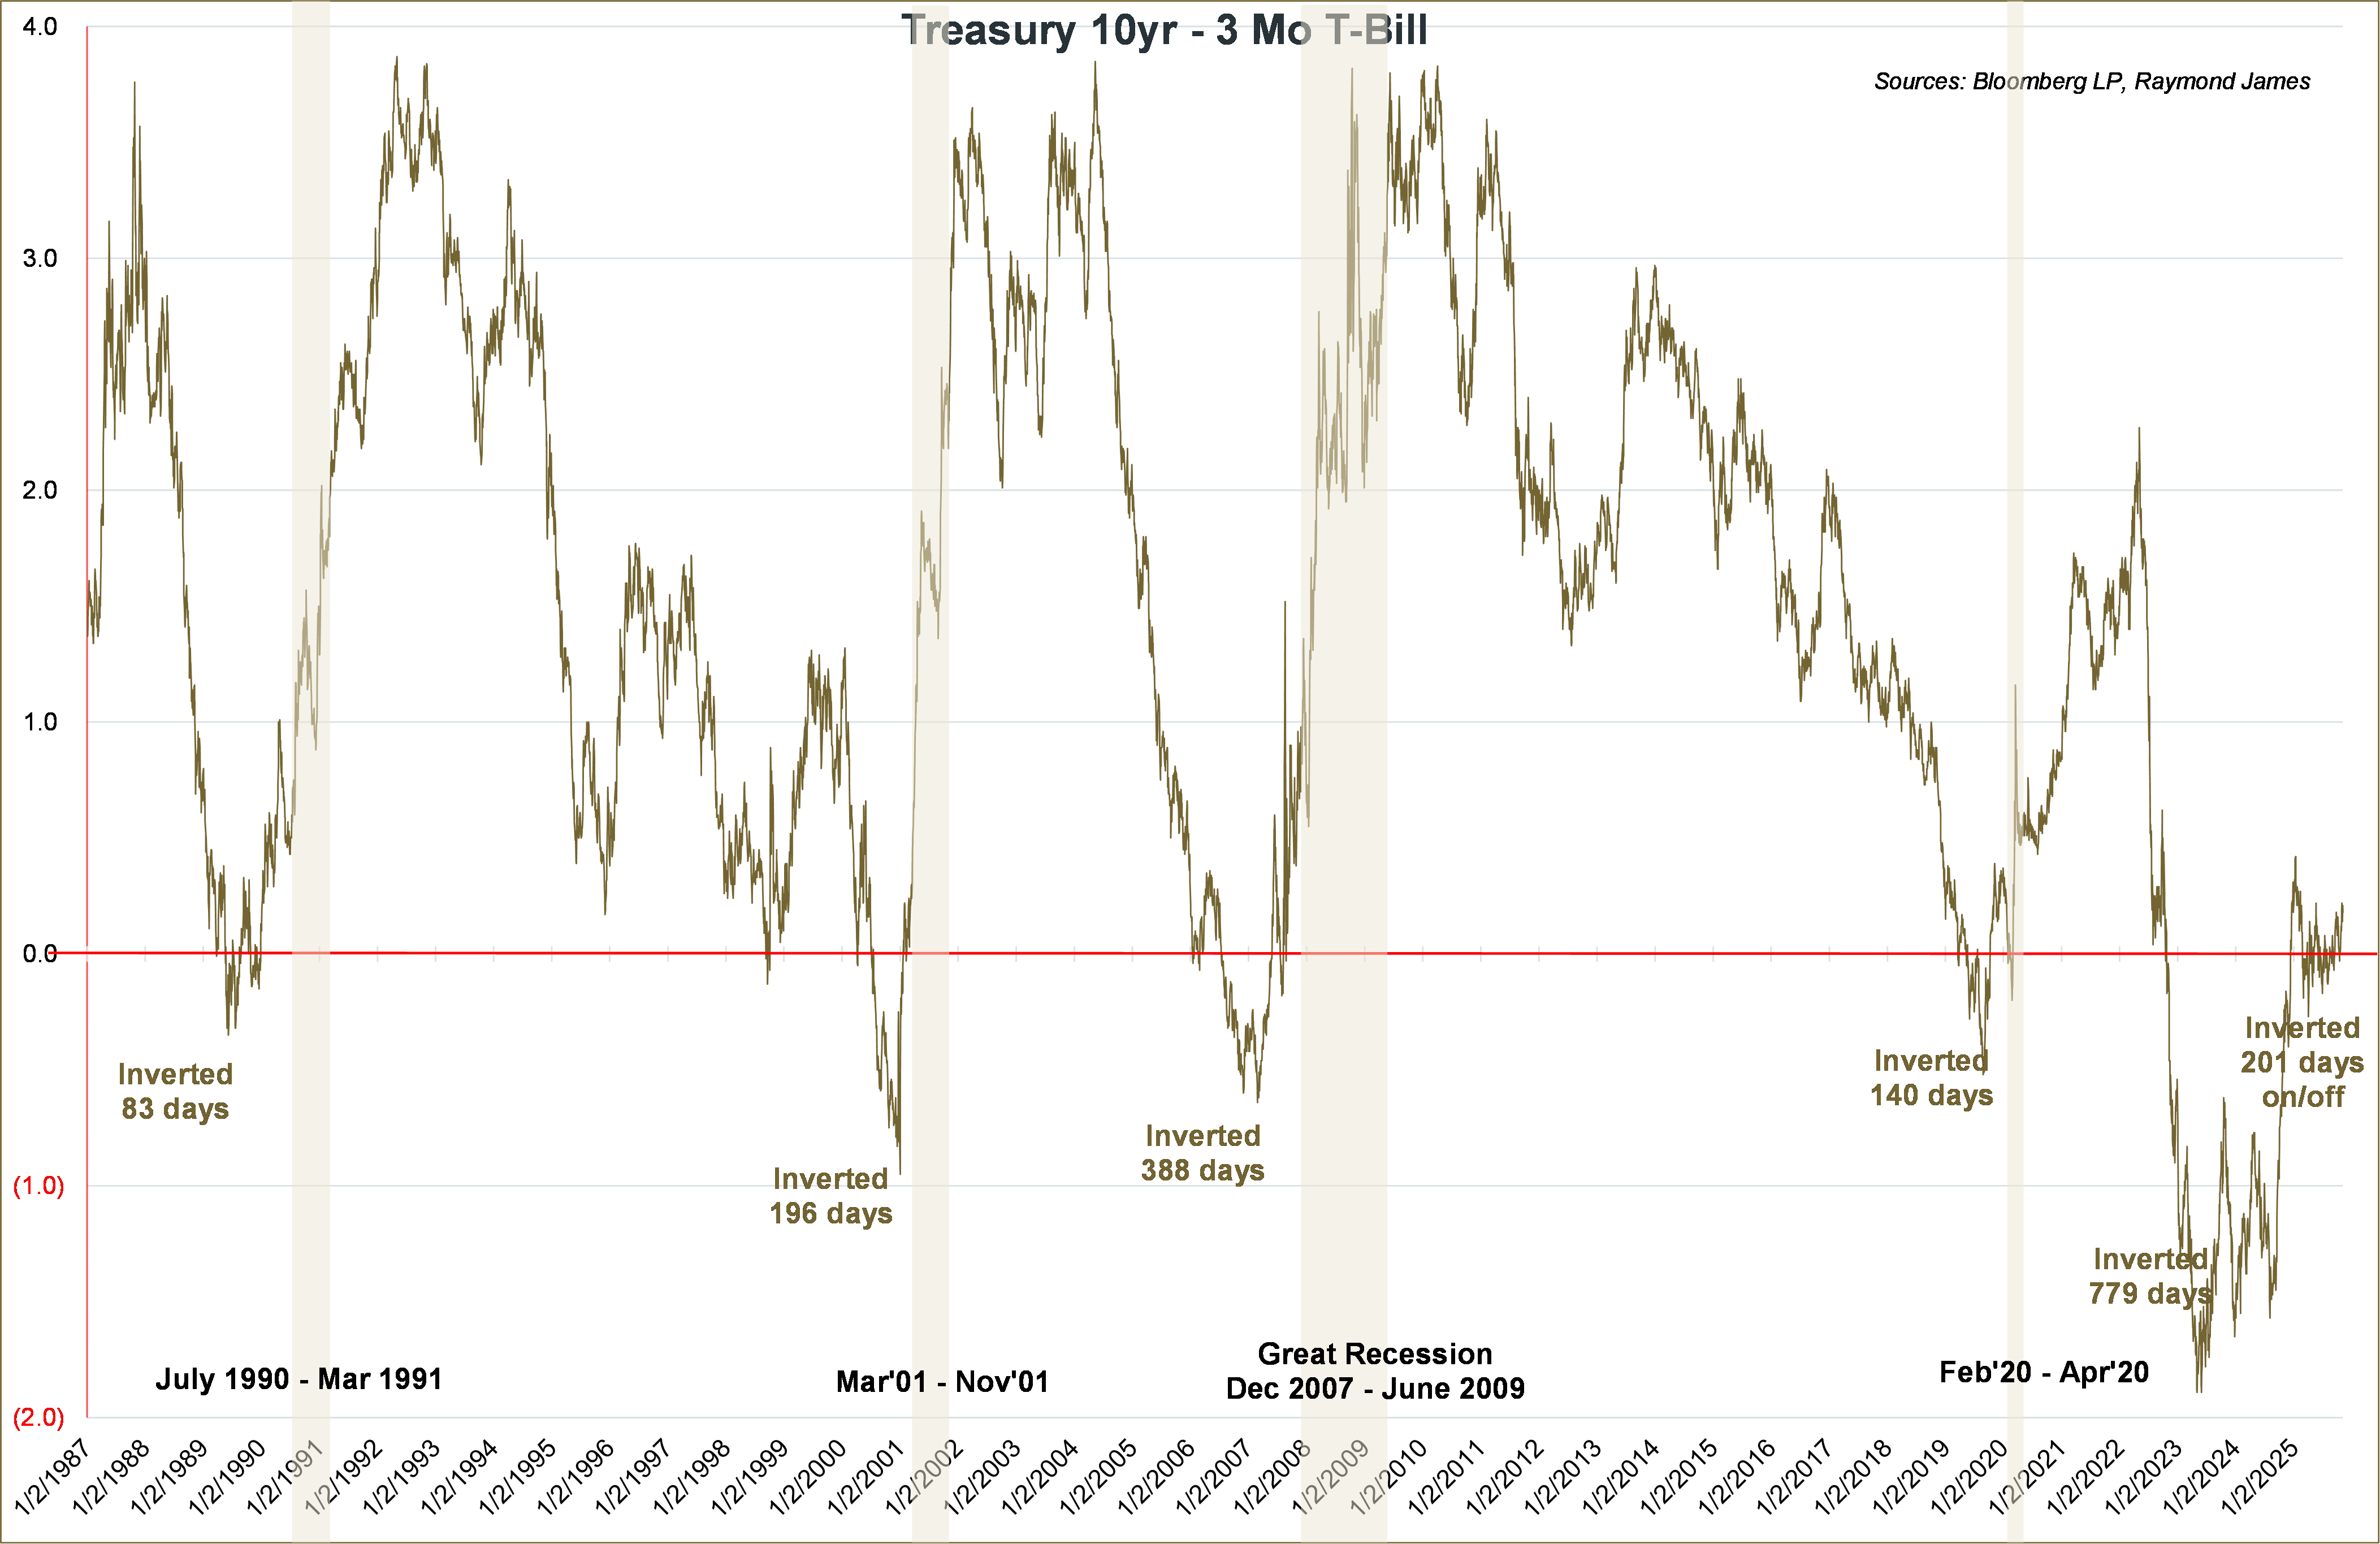
What does this mean for investors? This serves as a reminder to maintain a balanced investment portfolio comprising growth assets (equities) and wealth preservation assets (bonds), as market cycles will eventually play out.
The author of this material is a Trader in the Fixed Income Department of Raymond James & Associates (RJA), and is not an Analyst. Any opinions expressed may differ from opinions expressed by other departments of RJA, including our Equity Research Department, and are subject to change without notice. The data and information contained herein was obtained from sources considered to be reliable, but RJA does not guarantee its accuracy and/or completeness. Neither the information nor any opinions expressed constitute a solicitation for the purchase or sale of any security referred to herein. This material may include analysis of sectors, securities and/or derivatives that RJA may have positions, long or short, held proprietarily. RJA or its affiliates may execute transactions which may not be consistent with the report’s conclusions. RJA may also have performed investment banking services for the issuers of such securities. Investors should discuss the risks inherent in bonds with their Raymond James Financial Advisor. Risks include, but are not limited to, changes in interest rates, liquidity, credit quality, volatility, and duration. Past performance is no assurance of future results.
Investment products are: not deposits, not FDIC/NCUA insured, not insured by any government agency, not bank guaranteed, subject to risk and may lose value.
To learn more about the risks and rewards of investing in fixed income, access the Financial Industry Regulatory Authority’s website at finra.org/investors/learn-to-invest/types-investments/bonds and the Municipal Securities Rulemaking Board’s (MSRB) Electronic Municipal Market Access System (EMMA) at emma.msrb.org.
